There are several kinds of SQL trace files which can be created using PeopleSoft to load into Pace-Trace: online trace files, Application Engine, and COBOL. Each of these trace files typically look about the same, but are found at different locations and require different steps to create them.
Quick Jumps
Online: Trace an entire session
Online: Interactive Tracing
Application Engine
COBOL
Creating Online Trace Files
For most research, an online trace file gives you exactly the type of information you need. This type of trace file shows you the database statements executed while as long as you have tracing turned on. This type of tracing is excellent to see what tables PeopleSoft uses to populate a page, or see where it stores a value you enter when you click the Save button, for example. For the less technically-minded, this is likely the only trace file that will be of much interest.
Although tracing of batch processing can be a little tricky, tracing online processing presents very little risk, and can be quite useful for even the non-programmer.
Trace an entire session
In general, you should be able to turn on tracing for your particular online session by appending “&trace=y” to the login URL for your particular session. For example, if your standard PeopleSoft URL to login was http://dev.yormtu.edu/fsdev/signon.html, then you would use http://dev.yormtu.edu/fsdev/signon.html&trace=y to login using the tracing options page.
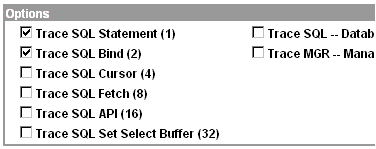
This should bring up a screen with checkboxes for various trace settings. For Pace-Trace, you will only need to turn on the first two checkboxes (titled “SQL statements” and “SQL statement variables”):

In fact, turning on additional checkboxes (especially the PeopleCode trace) will generate much larger trace files, slowing down the performance of the application, and take much longer to load into Pace-Trace.
After you have clicked the appropriate checkboxes and logged in, merely perform your operations online as you would normally. Each database call will be logged to a trace file typically stored in a directory on your application server. Ask your PeopleSoft administrator for the location of the online trace file for your particular implementation. Usually, all trace files for a particular database will be located in the same directory, and each filename will include such details as the current user name and the IP address of the machine you are using. One shortcut to quickly locating your trace file is to merely sort this directory to find the most recently modified file while you are still tracing.
Interactive Tracing
Using the URL method (described above), you can activate tracing for an entire PeopleSoft session. When you have direct access to the trace file (ie, without having to transfer the file from another computer to yours), this approach can work very well. In other cases, however, you may want to target just one particular action within the application, and trace just those actions. PeopleSoft provides a page which allows you to click checkboxes in much the same way as you do for a session, but to turn on tracing for just a particular point in time. Follow the steps below to selectively trace your actions.
- Log into PeopleSoft
- Navigate to PeopleTools > Utilities > Debug > Trace SQL
- Click the first two checkboxes (Statement & Bind) on the screen, as follows:

- Click the Save button.
- In the other open window, perform whatever steps you want to trace.
- When you are finished, uncheck the boxes above and click Save again.
Using this method, you can build a trace file with only the specific statements you want to view. This method is particularly helpful if you do not have direct access to the trace file, and must have it transferred from one system to another, as the file is kept as small as possible.
Activating Tracing for Batch Routines
Depending on the particular configuration at your implementation, tracing may be already turned on for your batch (AE and COBOL) programs. If not, you can either have tracing turned on for all batch processing (a common setting for a development environment, assuming performance or disk space is not significantly degraded), or turn on tracing for a particular process. If you are questioning if this is the right approach, ask your administrator if turning on tracing for all batch processing is an option. The instructions vary depending on what type of trace file you want, so read the appropriate section for more information.
Application Engine
Turning on tracing for Application Engine is fairly straightforward if you are familiar with Process Scheduler. This merely involves appending the TRACE and TOOLSTRACESQL flags to the end of the command line for a particular process you would like to trace.
- Open the Process Scheduler Definition
- Select the “Override Options” tab
- Choose “Append” to the right of “Parameter List”
- Add the following text for “Parameters”:
-TRACE 3 -TOOLSTRACESQL 3
The settings above actually create two files, but only one can be opened by Pace-Trace. The -TOOLSTRACESQL setting creates the trace file used by Pace-Trace. The —TRACE setting is used to create a trace file ending in “.aet”. I recommend creating that file as well since it contains one additional and valuable piece of information: the number of rows affected by any SQL operation (e.g., number of rows deleted, updated, inserted, or selected).
Caution: The AET file is more readable, and does have the number of rows updated in the database; for that reason, people tend to solely refer to this trace output. However, this file does not contain SQL that was executed from within PeopleCode steps (eg. SQLExec or SQL.Execute operations). To ensure you are viewing ALL SQL executed during the run of an App Engine program, I recommend using the tracesql file (the file generated by using -TOOLSTRACESQL). But as again this file is not formatted well, I also recommend using Pace-Trace to view it!
For trivia, the number “3” at the end of each of these settings are bitmasked values: they represent a combination of the two settings (1) SQL statement and (2) SQL statement variables (1 + 2 = 3).
COBOL Tracing
For COBOL the idea is similar to AE, but instead of appending to the parameter list, we override it. This process is a little more tricky. You will need to first open the Process Type (not Process) definition for your particular operating system and database which is being used to run your particular COBOL process (for example, Unix/Oracle). From there, we will modify the command-line and then update the Process (not Process Type) with the new command-line which includes the trace flag. The detailed instructions are provided below.
- Open the correct Process Type definition and copy the entire parameter list text.
- Open the Process definition of the COBOL process you wish to trace.
- Select the “Override Options” tab
- Choose “Override” to the left of “Parameter List”
- For “Parameters,” paste in the copied text from before.
- Now find where in this original parameter string there are two “/” characters together (possibly between the %%INSTANCE%% and %%DBFLAG%% variables).
- In between those two “/” characters, place a “3” (without quotes)
For example: If the end of the line read %%/%%INSTANCE%%//%%DBFLAG%%, then the new line would read like this:
%%/%%INSTANCE%%/3/%%DBFLAG%%
Again, the number 3 placed into these parameters are bitmasks: they represent a combination of the two settings (1) SQL statement and (2) SQL statement variables (1 + 2 = 3).
Opening your batch SQL trace file
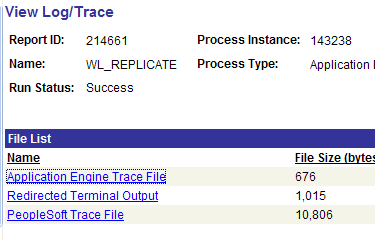
After the AE or COBOL program has finished, switch to the Process Monitor and click the “Details” link next to the module that you are studying. In opened “Details” page, click “View Log/Trace.” From here, there will frequently be more than one file to choose from. Choose the one that reads “PeopleSoft Trace File.”

In the screen-shot above, the last item should contain the trace file you wish to open. Since the size of these trace files can easily become quite large, you may want to simply right-click on the link of the trace file and save the file to your local machine (Typically “Save Target As…” or “Save Link As…” depending on your browser) before trying to open it; otherwise, the trace file will open into a new browser window. With very large files, this can end up causing problems for your machine.
Additional Notes
Are there SQR trace files?
SQR does not create “trace” files, but can provide some additional information for you. By appending “-S” (without the quotes) to your command-line by editing your Process Definition, you cause the “cursor status” to be written to the log. From the SQR help file: “Requests that the status of all cursors be displayed at the end of the report run. Status includes the text of each SQL statement, number of times each was compiled and executed, and the total number of rows selected. This information can be used for debugging SQL statements and enhancing performance and tuning.” (Thanks Shailesh for the tip!)
See something wrong?
PeopleSoft/Oracle continually changes the steps to turning on tracing. Because of this, it is hard to guarantee that these instructions are always accurate. Please do let me know, however, if you do see something wrong, have some helpful suggestions, or anything else. Just use the contact form, and I will update my site to help make sure this page remains useful. And of course, always refer to your helpful PeopleBooks for the “final answer.”
